Ditch Your Pies and Bars
No! Not another pie! I rail against any seller that parades a pie chart or histogram in their deck of slides. Doughnut slices and skyscraper landscapes are surely a major bane of an audience’s life. They are useless. They are not fit for purpose. They are not memorable. They shroud the real point.
So what joy, courtesy of background CNN in an office reception, that I saw the Google Newsmap. It visually trends news stories by volume of recently published articles. Here’s a thumbnail screengrab from lunchtime today, Wednesday 8 September, with the UK tab clicked.
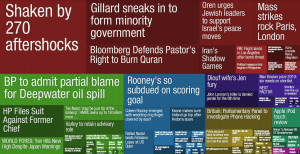
I loved it. You can play with topics, and thereby colours, timelines and territories.
Now. Ever heard of the ‘billion-dollar-o-gram’? The genius that is self-styled “data journalist” David McCandless created it. He aims to make sense of incomprehensibly huge numbers, comparing different billion-laden amounts. Here’s another screengrab.
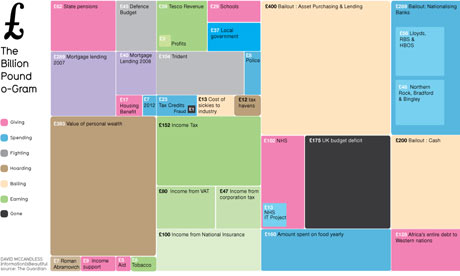
They both open up a whole bunch of winning ideas for alternatives to the outdated pie and bar charts.
I immediately wished that the last prezz I witnessed had rather have applied this technique when it came to describing the financial breakdown of a new venture’s business plan. Why on earth show the summarised balance sheet as a table, and the odd donut, when you can do this?
Next time you’ve several different classes of ‘data’, especially if there are sub-sets within them, fill your Powerpoint page with boxes, corresponding to their weight, point out a key measure that is of surprising size, and your audience will actually remember that slide for sure.