Deal Hurricane Spaghetti Models
As the latest ‘worst ever’ hurricane, Irma, slams through the Caribbean, I saw for the first time the forecast amalgam of the spaghetti model.
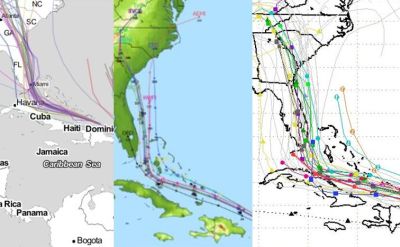
The idea is that every weather watcher that suggests where the cyclone is headed has their path plotted. You can see by how much they differ in their (un)glorified guesswork. As each day passed along its 16mph devastation, the spaghetti moved quite considerably. One hour Havana was toast, Miami spared. Only for an hour later, a total reversal.
I show above just a trio of the many such graphical representations various ‘official’ feeds shared.
Yet the one treatment I was most entertained with is less geographic, and more concerned with Mother Nature’s power over time. These people term it an (experimental) Intensity Graph;
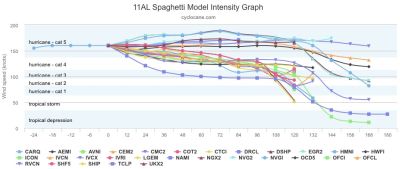
I wondered if there’s scope on an ‘account review’ of ‘deep dive’ deal analysis to think in these terms?
I do struggle to think of any sales outfit geared up to devote time to such output. Even those with a traditional supposed second-in-command of Sales Ops Manager. (As they’re sadly in my experience far from the required process gurus, instead focusing – being told to focus? – on elements of compliance.)
Yet if you could jot down your process markers over the bid timeline and work out where deviation, delay and drama might occur, then you could well be onto something. Such as nailing where you accelerate, enjoy “gateway” progression and gain key agreements, or stumble and fall. At the very least you’ll get closer to the tropics of Sales success that refining where your process wins brings.