Guess The Data Lines
Reading the always insightful economist writer and broadcaster, Liam Halligan, I noted his publisher's approach to graphs.
In this case, London broadsheet The Telegraph. The country's most read paper of its type.
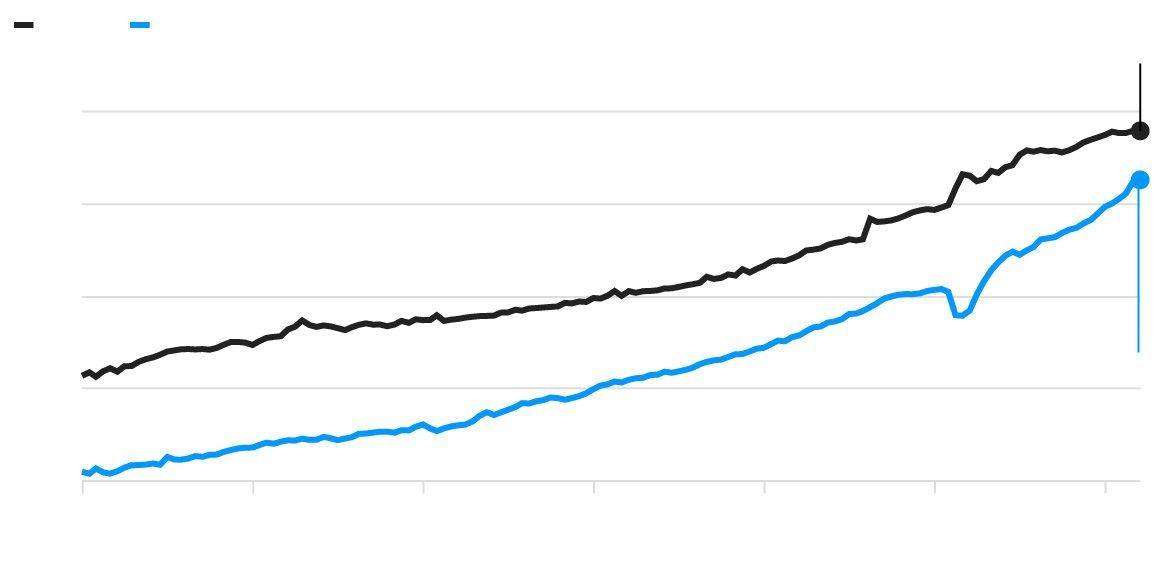
This chart especially caught my interest. When clicking on it to peruse further, the image above presents.
It reminded me of the lovely tactic of putting up your chart without any accompanying labels.
What topic doyen Edward Tufte coined as data-ink. A fervent believer that less is absolutely more. Every instance of alphanumeric characters on a graphic requires a reason. One you may well not justify upon inspection.
Above demonstrates the 'before' of a deft two-part engagement and memory implanting technique. A winner when chart components are likely to surprise.
Indeed, popular twitter accounts like to challenge their followers in similar fashion. Asking of text-free, denuded charts, 'guess the data set'.
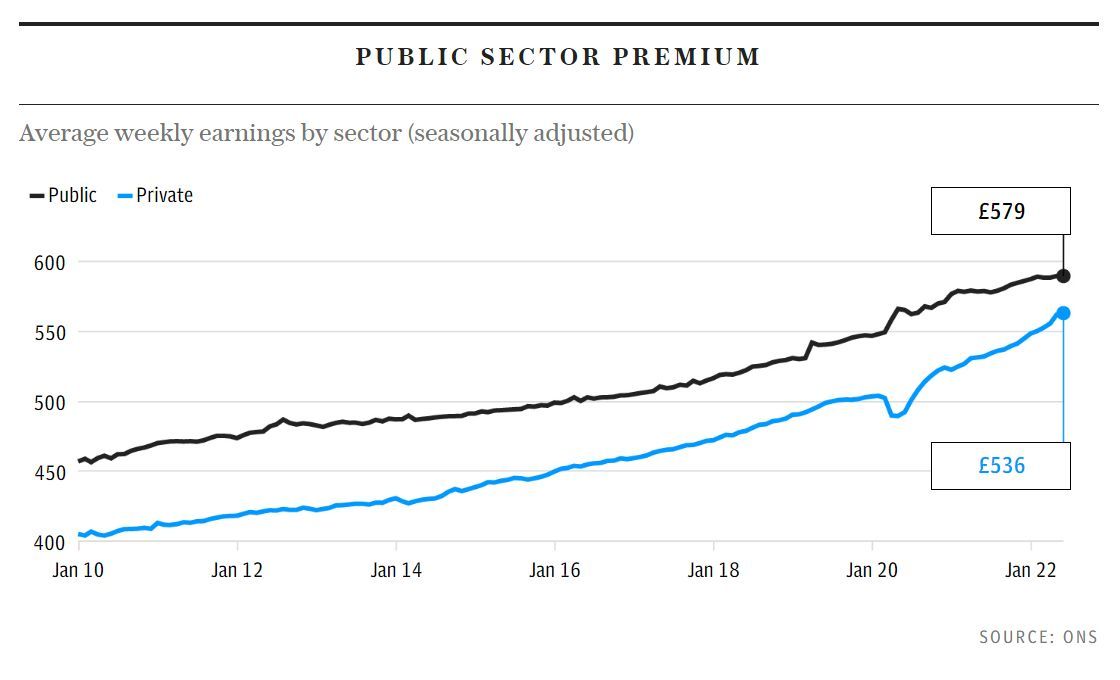
In this particular article, the author was busy busting the lower paid public sector worker myth; "astonished this reality is so rarely commented upon".
Lines represent average weekly salary in either public or private sector. One being 8 percent higher. So which is which?
Not every graph lends itself nicely to this. But when one does, go for it. Your prospect and your commission pot will thank you for it.