Warming Stripes
A seasonal Summer-time posting. Yet to take into Sales would mean a fair old amount of work though.
If you’ve a time series you’d like to represent slightly differently from the traditional bar chart or line graph, then you could try a treatment akin to these style of stripes.
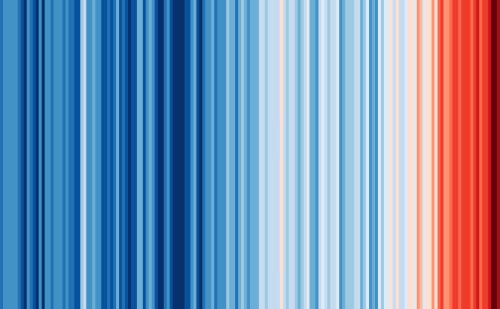
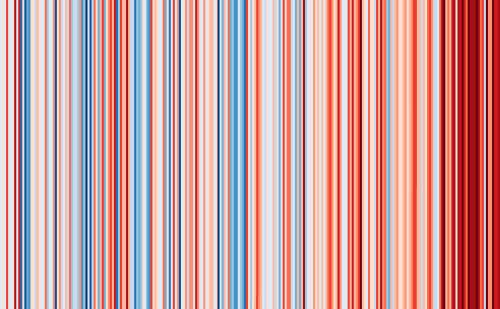
The above image is by University of Reading climate scientists. It shows each year’s average global temperature between 1850-2017. The rise being 1.35°C.
They show several different locations too. As also posted to twitter, here with their first insight. Central England from 1772-2017 where dark blue 7.6°C rises to 10.8°C dark red;
There’s plenty of palettes you can find online for this kind of graded-by-colour look. The most common being for ‘heat’. You can even use derivatives of a single colour to affect a meaningful scale.
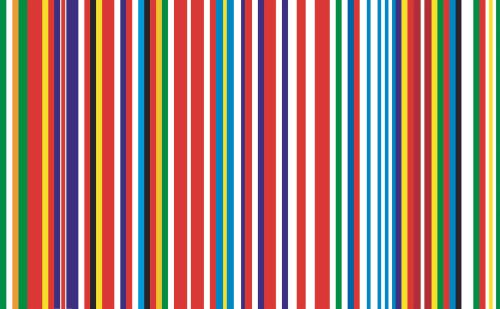
Or you could use brand hues as signifiers. Here’s an example from the famed Rem Koolhaas Barcode EU Flag idea. As updated below with another one required 29 March 2019… Each member’s flag represented in their vertical slot roughly placed by west to east geography;
What about the colours of the Gerhard Richter strips for inspiration? Here’s Richter’s 921-4 Strip (2011) that I once had as my phone wallpaper for a while during 2012;

The salesdeck application is to make your dataset memorable. Whether it be breaking down by the hour, day, month, year, the visual effect can be lasting. Only one slide need be crafted. Yet be prepared to put a decent chunk of time in. The foundation isn’t that tricky. Simply working out the width of each timeslot ‘stripe’. Then creating one and replicating it to fill your slide. (‘Group’ and stretch if required.) The potential time thief is in first arriving at a colour scheme then next, giving each one its own particular splash.