Adding Markers To Bars
Here’s an interesting chart treatment.
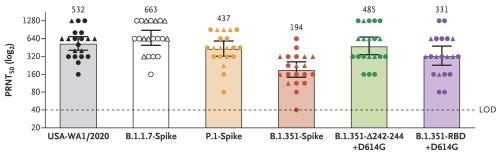
From Monday’s New England Journal of Medicine (NEJM).
Reporting first-run vaccine success against variants which mutated into view after initial release.
What do all the annotations stand for?
The error bars, yes. Unicode has an option useful for text insertion [⧱]. Various arrows exist too [ᛨ]. Then there’s the standard super-serif’d capital ‘I’. Or as used here, no. 2336 the ‘APL Functional Symbol I-Beam’ [⌶].
Grey areas, variance around the edges, even pending transactions.
But then what of all those circles and triangles?
Well, it seems they indicate results after different timespans. The circles, a fortnight, triangles four weeks.
Each bar features twenty in total. So this raw data makes for a kind of barchart in itself. Looking a bit like perhaps a centred unit chart.
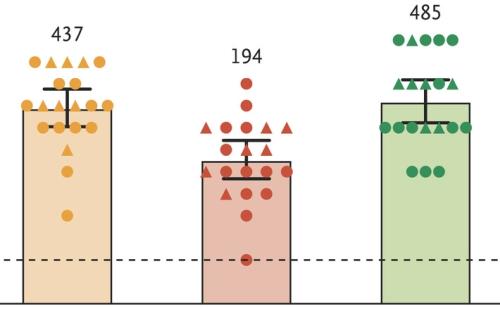
The number above each bar is the geometric mean of the twenty values which combine for it. Which matches the bar height. The bars indicate 95% confidence intervals. And note that the x-axis has a scale which doubles every calibration. Making the lowest data, where the dotted line sits, at a value of ’20’.
The point about this coronavirus vaccine presentation, is that it may well give us belief to add to our charts too.
Especially where you which to highlight a specific, yet potentially hidden, data point.
Spotlighting a certain value. Showing a range-within-a-range. Amplifying a spread.
And when revealed a step at a time (‘progressive disclosure’) can both grip your audience with a story, make them feel cleverer for understanding it, and get them better on board with your findings and recommendations.