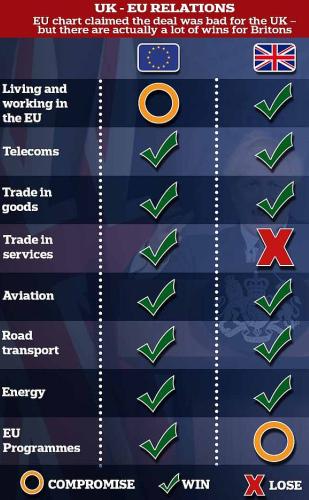
Negotiation Tracking ✓ X O
dailymail table graphic
Another emergence from the Brexit deal. The planet’s largest current talks securing a £660bn arrangement. With post-match spin quick to surface.
The British leaked documents preferring to suggest their ‘win ratio’ was higher; 28 to 11 with 26 drawn.
The European Union strangely opting to slant every decision in the context of now invalid, historical positions.
Regardless of the propaganda war, a number of elements are certainly of interest to solution sellers tasked with fully seeing deals over line.
Precisely pinpoint each party’s starting positions.
Know your ‘currencies’; what you have to bargain with and how they can move.
Isolate your red lines (point beyond which you cannot go) and best outcomes.
And critically with an eye on ‘selling’ the deal to those back at base, record where – and by how much – you have won, lost or compromised.
Part of the fun in reading the aftermath, is in how both sides here each misrepresent the other’s stance at the beginning and how they either play down or up movement given or gained.
Many a grid shows final tallies graphically.
Using a green tick, big red cross, or amber circle outline.
✓ X O
The interesting thing for us with these, are that the graphic tables with these symbols next to each category appear to earn greater recall and undue prominence compared to the detail.
Something well worth tapping into during, and especially after, your next deal negotiation.